The confusion runs deep because payout rate, interest rate, IRR, and CAGR get used interchangeably. They're not the same, and plugging the wrong metric into a comparison leads to bad decisions.
This guide clarifies which metric fits which annuity type, walks through the exact calculation steps for each, and covers the variables and mistakes that distort your numbers.
Key Takeaways
- Annuities use multiple return metrics — payout rate, total return, CAGR, and IRR — and each measures something different
- Payout rate (Annual Income ÷ Premium) compares income annuity quotes but doesn't measure investment growth
- CAGR measures annualized growth for fixed, variable, and indexed annuities during accumulation
- IRR gives the most precise return figure for income annuities, though results shift significantly based on how long you live
- Which calculation to use depends on your annuity type, fees, time horizon, and crediting method
Understanding Which Annuity Rate of Return Metric to Use
Not all annuities work the same way, so no single return formula fits every product.
The first distinction to get right: payout rate is not an interest rate. New York Life makes this explicit — payout rates include both interest and return of principal, meaning a portion of each payment is simply your own premium coming back. Treating payout rate as an earnings yield overstates actual returns.
The second distinction is phase-based. The IRI defines the accumulation phase as the period before annuitization, when money is building up inside the contract. The payout phase is when regular income begins.
Immediate annuities skip accumulation entirely, which is why the SEC notes they have no accumulation phase. Each phase calls for a different metric.
A Quick Decision Guide
| Situation | Metric to Use |
|---|---|
| Comparing income annuity quotes | Payout rate |
| Measuring growth on a fixed or indexed annuity | CAGR |
| Evaluating the true return on an income annuity | IRR |
| Quick check on overall account growth | Total return |
The table above maps each scenario to a starting point. Here's how to apply it:
For accumulation-phase annuities (fixed, variable, indexed): use total return and CAGR. These measure contract value growth relative to your contributions over time.
For income/immediate annuities: use payout rate for quote comparisons, and IRR for the most precise return estimate, keeping in mind that IRR depends heavily on how long payments continue.
How to Calculate Annuity Rate of Return: Step-by-Step
Step 1: Calculate the Payout Rate (for Income Annuities)
Formula: Annual Income ÷ Premium = Payout Rate
Example: A $100,000 premium generates $640/month in income.
- Annual income: $640 × 12 = $7,680
- Payout rate: $7,680 ÷ $100,000 = 7.68%
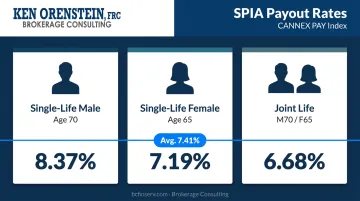
For context, the CANNEX PAY Index (April 2026) shows an average yield of 7.41% on a $100,000 immediate annuity, with rates varying by age and gender — 8.37% for a single-life male at age 70, 7.19% for a single-life female at age 65, and 6.68% for a joint M70/F65 scenario.
What payout rate tells you: How much of your premium is returned per year as income — useful for comparing quotes side by side.
What it doesn't tell you: How much your money is actually earning. Because payout includes return of your own principal, a high payout rate doesn't mean a high earnings rate.
Step 2: Calculate Total Rate of Return (for Accumulation Annuities)
Formula: (Current Value – Contributions) ÷ Contributions × 100
Example: A $100,000 contribution grows to $130,000.
- Total return: ($130,000 – $100,000) ÷ $100,000 × 100 = 30%
FINRA defines total return as the change in value plus all income collected, and notes that fees should be factored in when calculating performance.
Limitation: Total return shows overall growth but ignores how long the money was invested. A 30% gain over 5 years is very different from 30% over 15 years — which is exactly why CAGR exists.
Step 3: Calculate Compound Annual Growth Rate (CAGR)
Formula: (Ending Value ÷ Starting Value)^(1 ÷ Years) – 1
Example: $130,000 ending value on a $100,000 contribution over 10 years.
- ($130,000 ÷ $100,000)^(1/10) – 1 = 2.66% CAGR
According to Investopedia's CAGR guide, CAGR represents the mean annual growth rate over a period longer than one year — a standardized way to compare performance across different time horizons.
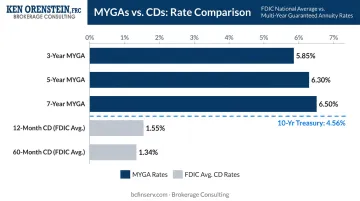
Why CAGR matters more than total return: It puts growth on an annualized basis, making it possible to compare your annuity against alternatives like CDs or bonds. As a benchmark, Blueprint Income's May 2026 MYGA data shows fixed annuity rates of 5.85% for 3 years, 6.30% for 5 years, and 6.50% for 7 years — all significantly above FDIC national average CD rates of 1.55% for 12 months and 1.34% for 60 months as of May 2026.
Step 4: Calculate IRR for Income Annuities
IRR can't be solved with a simple formula. It requires a financial calculator or spreadsheet — an Excel IRR function or equivalent spreadsheet tool.
Inputs needed:
- The premium paid (entered as a negative cash flow — it's money going out)
- Each periodic payment received (positive cash flows)
- Total number of expected payments
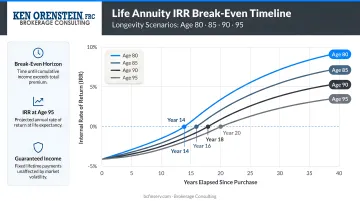
For a life annuity, you don't know how many payments you'll receive — that depends on how long you live. IRR is best modeled as a range across multiple survival scenarios: age 80, 85, 90, or 95, rather than a single number.
In the early years, cumulative payments haven't yet matched the premium paid. IRR is typically negative or near zero for the first 15–20 years.
It turns positive only after collected payments surpass the original premium — the "break-even" point. Running multiple longevity scenarios is the only way to see the full picture.
MIT/NBER research by Poterba and Solomon (2025) illustrates the mortality risk dimension: a 65-year-old man buying a $100,000 SPIA with no guarantee period has a 4% chance of dying before collecting payments worth $25,000 in present value (meaning he must live to age 70), and an 11% chance of dying before collecting $50,000.
These probabilities shift significantly at older purchase ages — which is why modeling IRR at ages 80, 85, and 90 gives a far clearer picture of realistic outcomes than any single estimate.
Key Variables That Affect Your Annuity Rate of Return
Annuity Type and Crediting Method
How your annuity credits interest determines which inputs go into your return calculation:
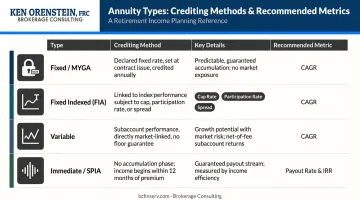
- Fixed annuities (MYGAs): Declared interest rate credited each year — CAGR is straightforward
- Fixed indexed annuities (FIAs): Return depends on index performance filtered through caps, participation rates, or spreads. The NAIC defines these as: cap rate = maximum interest credited in a term; participation rate = percentage of index gain credited (e.g., 65%); spread = percentage subtracted from index gain before crediting. Each of these limits upside, so actual credited returns differ from raw index performance
- Variable annuities: Return depends on subaccount investment performance, which varies with markets
- Immediate annuities: No accumulation phase — evaluate using payout rate and IRR only
Fees and Their Compounding Impact
Fees reduce effective return year over year, and the effect compounds significantly over time. According to SEC data:
| Annual Fee | $100,000 at 4% for 20 Years |
|---|---|
| 0.25% | ~$208,000 |
| 0.50% | ~$198,000 |
| 1.00% | ~$179,000 |
For variable annuities specifically, the SEC reports M&E charges typically run ~1.25% annually, plus administrative fees of roughly 0.15% or $25–$30 per year.
Add living benefit rider costs — which per Brokerage Consulting's internal experience typically run 1.0–1.5% annually on the income base — and total variable annuity costs can exceed 3% per year. At that level, a 6% gross return nets out below 3% — less competitive than many simpler alternatives.
Always calculate net-of-fee return before comparing against alternatives.
Time Horizon and Surrender Periods
Longer accumulation periods improve CAGR for fixed annuities, because guaranteed rates compound over more years. Early withdrawals during the surrender period directly reduce effective return through penalties.
Surrender schedules often run 6–10 years with charges declining annually. A typical 10-year schedule looks like:
- Year 1: 9% penalty, declining by 1% each year
- Year 10: 0% (fully liquid)
Ignoring surrender charges in your return calculation will overstate actual results on any early exit.
Life Expectancy (for Income Annuities)
For a life annuity, the assumed lifespan is the single biggest variable. IRR only turns meaningfully positive after the break-even point — typically 15–20 years into payouts.
Scenario illustration:
- Living to age 80 (15 years of payments after starting at 65): IRR likely near zero or slightly positive
- Living to age 85 (20 years): IRR improves meaningfully
- Living to age 90 or 95: IRR becomes increasingly favorable
SSA actuarial tables show remaining life expectancy at age 65 is 17.5 years for males and 20.1 years for females — meaning the average buyer lives just past the typical break-even point. Anyone significantly below average lifespan may see a negative IRR.
What Is a Good Annuity Rate of Return?
"Good" depends entirely on annuity type and what you're comparing it to.
Current benchmarks by annuity type (as of mid-2026):
| Annuity Type | Current Rate Benchmark |
|---|---|
| MYGA (3-year) | ~5.85% |
| MYGA (5-year) | ~6.30% |
| MYGA (7-year) | ~6.50% |
| SPIA payout yield (avg, age-dependent) | ~7.41% (CANNEX PAY Index) |
| Fixed indexed annuities | Varies; no single public benchmark available |
| Variable annuities | Depends on subaccount selection; no single public benchmark |
The right comparison depends on annuity type:
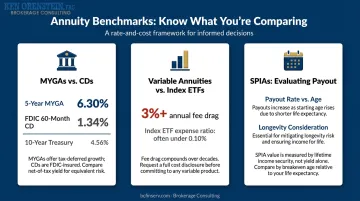
- MYGAs vs. CDs: FDIC national average 60-month CD rates sit at 1.34%, while 5-year MYGAs are running at 6.30%. The 10-year Treasury yield of 4.56% (May 2026) provides a middle reference point
- Variable annuities vs. index ETFs: After fees exceeding 3% annually, variable annuity net returns often underperform low-cost index funds — making a fee-adjusted comparison essential
- SPIAs: Evaluate on payout rate relative to your age, health, and expected longevity — not as a yield-only comparison
For federal employees and retirees who already have FERS pension, TSP, and Social Security, the real question isn't just "what rate does this annuity pay?" — it's whether adding an annuity meaningfully improves total guaranteed income.
That's where working with a specialist matters. Ken Orenstein at Brokerage Consulting focuses specifically on structuring retirement income across multiple guaranteed sources for federal employees, integrating annuities where they complement existing benefits rather than simply chasing a headline rate.
Common Mistakes When Calculating Annuity Rate of Return
Three calculation errors account for most of the misleading return figures you'll encounter when evaluating annuities. Avoiding them keeps your comparisons honest.
Confusing Payout Rate With Interest Rate
This is the most common error. A 7.68% payout rate does not mean the annuity earns 7.68% annually — part of each payment is simply return of your own premium. When someone sees a high payout rate and compares it directly to a CD yield or bond return, they're not comparing equivalent metrics. The annuity will appear far more attractive than a direct comparison would show.
Ignoring Fees When Calculating CAGR or Total Return
Using the gross contract value without subtracting rider charges, M&E fees, administrative fees, or fund expenses produces inflated return figures. A variable annuity with a 7% gross subaccount return and 3% in total fees delivers a 4% net return — which looks very different next to a low-cost index fund. Always net out fees before any comparison.
Using a Single Life Expectancy Assumption for IRR
Plugging in one lifespan scenario produces a deceptively precise number. IRR for life annuities should be modeled across a range — at minimum, scenarios for ages 80, 85, 90, and 95 — to understand the realistic spread of possible returns. A single point estimate hides the longevity risk embedded in every income annuity.
Frequently Asked Questions
How do you calculate the rate of return on an annuity?
The method depends on the annuity type. Use payout rate (Annual Income ÷ Premium) for income annuities when comparing quotes. Use CAGR or total return for accumulation-phase annuities (fixed, variable, indexed). Use IRR for the most precise return estimate on income annuities, modeled across multiple life expectancy scenarios.
What is the difference between a payout rate and an interest rate on an annuity?
A payout rate reflects what percentage of your premium is returned annually — combining both principal and interest in each payment. An interest rate reflects only the growth or earnings component. Payout rate is useful for comparing income annuity quotes; it should never be used as a measure of investment return.
What is a good rate of return for an annuity?
It depends on the product type and goal. Current MYGA rates run approximately 5.85%–6.50% depending on term, while SPIA payout yields average around 7.41% but vary by age and gender. For income annuities, evaluate payout rate relative to your age and life expectancy — not as a standalone yield figure.
How do fees affect annuity rate of return calculations?
M&E charges, rider costs, and fund expenses reduce effective return and compound over time — always subtract them before calculating CAGR or comparing products. A 1% annual fee on a $100,000 portfolio reduces a 20-year ending value from approximately $208,000 to $179,000 compared to a 0.25% fee structure.
Does annuity type change how you calculate rate of return?
Fixed annuities use a declared rate, making CAGR straightforward. Indexed annuities apply cap, participation, or spread adjustments to index performance. Variable annuities depend on subaccount performance. Income annuities are best evaluated using payout rate for comparisons and IRR for precise return measurement.
Why does IRR on a life annuity start out negative?
In the early years, cumulative payments received haven't surpassed the premium paid — so the implied return is negative or near zero. IRR typically turns positive only after 15–20 years of payments, once the annuity holder has collected more than they originally invested. The longer you live beyond that break-even point, the stronger your effective return becomes.