
Introduction
Few financial products get pitched as often as they get misunderstood. Fixed indexed annuities (FIAs) are a prime example.
An FIA is an insurance contract that credits interest based on the movement of a market index — but your money isn't actually invested in that index. That distinction is what separates a realistic return expectation from a misleading illustration.
FIA sales reached $126.9 billion in 2024, up 32% from the prior year. That growth reflects real demand — but it also means more consumers are evaluating FIA illustrations without fully understanding what drives credited returns.
If you're a pre-retiree, retiree, or federal employee weighing FIAs as part of a retirement income strategy, this guide covers what historical FIA returns actually look like, what determines them, and why illustrated returns often diverge from real-world credited returns.
Key Takeaways
- FIAs don't invest directly in the market ; returns are credited based on index movement, subject to caps and participation rates
- Actual annualized FIA returns across 5-year periods ranged from 3.89% to 9.19% in real-contract research (Babbel, VanderPal & Marrion study)
- FIAs outperformed the S&P 500 in 67% of the studied 5-year periods because losses are floored at zero in down years
- Illustrated returns often use backtested exotic index data with today's cap rates held constant, which inflates projected results
- The right benchmark for an FIA isn't the S&P 500; it's a conservative blended portfolio — and FIAs often hold up well against that comparison
What Is a Fixed Indexed Annuity and How Are Returns Generated?
An FIA is an insurance contract — not an investment account. The NAIC's Buyer's Guide to Fixed Deferred Annuities defines it plainly: a fixed annuity that earns interest based on changes in a market index, with limiting features like caps and participation rates, and a floor that prevents index-linked interest from falling below zero.
The Mechanics Behind the Credits
The mechanics work in four steps:
- Premium goes into the insurer's general account — mostly fixed income assets (bonds)
- A portion of the bond yield funds an "options budget" — used to purchase call options on a market index
- When the index rises, gains are credited to your contract — up to the product's stated cap or participation rate
- When the index falls, your credited interest is zero — not negative
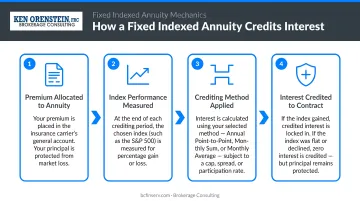
According to the American Academy of Actuaries, FIA providers invest most premiums in fixed income assets. A separate portion funds an options budget used to purchase derivatives (financial instruments tied to index performance) that generate the index-linked credits.
This is why FIAs occupy a middle position between fixed annuities (which pay a declared rate regardless of markets) and variable annuities (which have direct market exposure and can lose value). That tradeoff becomes clearer when you compare FIAs side-by-side with direct index investing.
How This Differs From Direct Index Investing
| Feature | FIA | S&P 500 Index Fund |
|---|---|---|
| Principal at risk from market decline | No | Yes |
| Dividends credited | No | Yes (total return) |
| Gains limited by cap or participation rate | Yes | No |
| Tax-deferred growth | Yes | Varies |
| Guaranteed floor | 0% | None |
For federal employees evaluating FIAs alongside TSP options, Ken Orenstein at Brokerage Consulting frames this distinction clearly: FIAs provide contractually guaranteed income regardless of market conditions, which addresses the sequence-of-returns risk that TSP distributions cannot eliminate.
What Do Historical FIA Returns Actually Look Like?
The most credible real-world data comes from the Babbel, VanderPal, and Marrion study — published through the Financial Planning Association and Wharton Financial Institutions Center — which analyzed actual FIA contracts and credited interest rather than hypothetical illustrations.
Actual Annualized Returns: 5-Year Windows
| 5-Year Period | FIA Annualized Return | S&P 500 Return |
|---|---|---|
| 1997–2002 | 9.19% | 9.39% |
| 1998–2003 | 5.46% | -0.42% |
| 1999–2004 | 4.69% | -2.77% |
| 2000–2005 | 4.33% | -3.08% |
| 2001–2006 | 4.36% | 5.11% |
| 2002–2007 | 6.12% | 13.37% |
| 2003–2008 | 6.05% | 3.18% |
| 2004–2009 | 4.19% | -1.05% |
| 2005–2010 | 3.89% | -1.47% |
Source: Real-World Index Annuity Returns, Financial Planning Association (Babbel, VanderPal & Marrion, 2011)
Three patterns stand out across these windows:
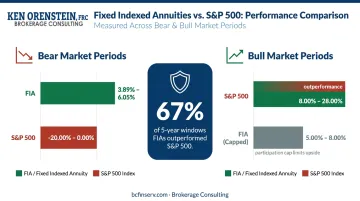
- During periods spanning the 2000–2002 and 2007–2009 bear markets, FIAs posted positive returns of 3.89%–6.05% while the S&P 500 produced negative annualized results
- During strong bull markets (2002–2007), the S&P 500 significantly outperformed — FIA caps limit upside participation by design
- The study found FIAs outperformed the S&P 500 in 67% of measured 5-year windows, and beat a 50% S&P 500 / 50% T-bill blended benchmark in 79% of periods
How Lock-and-Reset Works: A $100K Example
Assume a $100,000 FIA with an 8% annual cap, annual point-to-point crediting:
- Year 1: Index up 18% → credited 8% → account value: $108,000
- Year 2: Index down 35% → credited 0% → account value: $108,000 (unchanged)
- Year 3: Index up 22% → credited 8% → account value: $116,640
The "lock and reset" mechanic drives this outcome: previous credits are locked in, and each new year starts fresh — the contract doesn't recover prior index losses because it never absorbed them in the first place.
The 3.89%–9.19% return range reflects genuine variation — different entry points, different indexes, different cap structures. What your contract actually earns depends on three specific variables: when you started, which index your contract tracks, and what cap or participation rate applied during each crediting period. The same FIA product can produce meaningfully different outcomes depending on those inputs.
How FIA Interest Crediting Methods Determine Your Returns
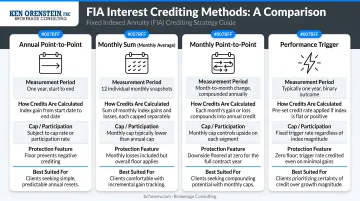
The crediting method is one of the biggest variables in FIA performance, and one of the least understood before purchase. Four main structures exist, each rewarding different market conditions differently — understanding them upfront can prevent surprises at renewal.
Annual Point-to-Point with Cap
The most common structure. Interest is calculated by comparing the index value at the start and end of a one-year period, then credited up to the cap.
- A cap of 8%–12% has been typical in recent years, though specific product caps vary significantly
- Higher interest rates give insurers a larger options budget from bond yields, which allows them to offer more competitive caps
- Caps reset at each renewal period — they are not fixed for the life of the contract
Monthly Averaging and Monthly Cap Strategies
Some contracts average monthly index values across the year or apply a monthly cap to gains (but not losses).
- Monthly cap strategies can underperform annual point-to-point in strongly trending markets. A 2% monthly cap still floors at 0% in down months (you don't lose credit), but strong months are capped — so a year where the index surges 25% in two months may credit far less than an annual measurement would
- Monthly averaging smooths volatility but can reduce credited interest during sharp year-end rallies
Participation Rate Strategies
Instead of a cap, these strategies credit a percentage of the index gain:
- A 70% participation rate on a 10% index gain = 7% credit
- Participation rate products have become more common, particularly paired with proprietary or volatility-controlled indexes
- Higher stated participation rates can be attractive, but they often apply to indexes with limited historical data, a real risk explored in the next section
Choosing among these structures depends on your income timeline, risk tolerance, and how long you expect to hold the contract. Brokerage Consulting reviews all four crediting methods (annual point-to-point, monthly point-to-point, monthly average, and monthly sum) with clients before any purchase decision is made.
Key Factors That Shape FIA Returns
Interest Rate Environment
This is the most direct lever. When bond yields rise, insurers generate more income from the general account, which expands the options budget. A larger options budget supports higher cap rates and participation rates.
The post-2022 rate environment is instructive: LIMRA noted in 2022 that insurers were able to offer very competitive crediting rates while protecting principal — a direct consequence of rising yields increasing the options budget. FIA sales grew from $79.4 billion in 2022 to $126.9 billion in 2024, partly driven by this dynamic.
Cap and Participation Rate Renewal Risk
Most buyers underestimate this one:
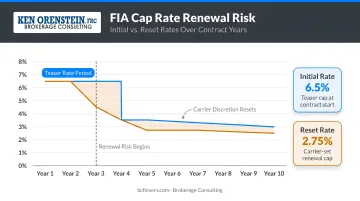
- Initial cap rates are only guaranteed for the first contract period (often one year)
- At each renewal, the insurer resets rates based on current bond yields, option costs, and their discretion — within contractual minimums
- Illustrations that assume today's cap rate persists for 10 years significantly overstate expected returns
- Requesting a carrier's renewal rate history before purchase is essential — it shows whether the carrier has maintained competitive rates or consistently lowered them at renewal
Index Selection
The index choice creates meaningfully different return profiles:
- S&P 500 — longest history, most transparent, most commonly benchmarked
- Russell 2000 / MSCI EAFE — different volatility and cycle behavior
- Proprietary or volatility-controlled indexes — often show higher participation rates, but the underlying performance data is backtested, not live. The American Academy of Actuaries confirms these modern products use custom indexes with volatility control and tactical algorithms
Fee Structures
Some products charge annual fees of 1%–1.5% to fund higher participation rates. In flat or mildly positive index years, those fees create a drag that can produce an effective return below zero — eliminating one of the FIA's core advantages.
Common Misconceptions About FIA Historical Returns
Illustrated Returns ≠ Actual Historical Returns
FIA illustrations are permitted to use historical index performance — including backtested exotic index data — to show projected returns under multiple regulatory scenarios per NAIC Model 245. Morningstar reports that illustrated annualized returns on some products reach 12%–17%, and NAIC regulators observed disclosures suggesting 10%–25% annual returns for several years.
NAIC Model 245 requires illustrations to disclose that shown values are not guarantees or estimates — but that disclosure is easy to overlook when a colorful chart projects a $1.2 million accumulation from $250,000.
The Babbel/VanderPal/Marrion data showing 3.89%–9.19% actual annualized returns represents real contracts, real credited interest. The illustration data does not.
Caps and Participation Rates Don't Stay Constant
Most illustrations project forward using today's rates as if they never change. They do. Morningstar specifically flags this: rates are commonly guaranteed only for an initial period and reset later based on market conditions and insurer discretion.Renewal rates can be significantly lower than initial rates. A consumer who purchased expecting an 11% cap might renew into a 7% cap three years later — a scenario that meaningfully affects long-term accumulation.
Key renewal-rate risks to understand before purchasing:
- Initial caps or participation rates are typically guaranteed for one contract year only
- Renewal rates are set at the insurer's discretion, subject to market conditions
- A rate drop from 11% to 7% cap can reduce credited interest by 36% or more in a given year
- Reviewing a carrier's actual renewal rate history — not just current illustrated rates — is essential
The S&P 500 Is the Wrong Benchmark
Comparing FIA returns to the S&P 500 total return (including dividends) creates an unfair comparison. FIAs don't capture dividends. They're not designed to replicate equity returns — they're designed to protect principal with index-linked upside.
Two more appropriate benchmarks emerge from the research:
| Benchmark | Source | Rationale |
|---|---|---|
| 20/80 portfolio (20% equity / 80% fixed income) | Morningstar | Reflects FIA's conservative, principal-protected risk profile |
| 50/50 stock/T-bill blend | Babbel study | Captures the hybrid return-and-protection trade-off |
The benchmark you choose changes the conclusion entirely. Working with an advisor like Ken Orenstein at Brokerage Consulting helps identify the right comparison point — and evaluate a carrier's actual renewal rate history — before committing to a product.
Conclusion
FIA historical returns are real, credible, and relevant — particularly for investors who prioritize principal protection and predictable retirement income. The data from the Babbel, VanderPal, and Marrion study confirms that actual credited returns were positive across every measured 5-year window, including those that spanned significant market corrections.
Where FIAs disappoint, the issue is usually presentation rather than product design. Illustrations, backtested exotic indexes, and static cap rate assumptions can make projected returns look far more attractive than what policyholders actually receive. Understanding the following factors matters more than fixating on a single "average return" figure:
- Crediting methods — annual point-to-point, monthly averaging, and how each affects your actual gain
- Cap renewal risk — initial caps are not guaranteed; renewal rates can drop significantly
- Index selection — proprietary indexes with volatility controls often underperform simpler S&P 500-linked strategies
- Fee structures — spread fees and rider charges reduce effective yield
- Benchmark context — comparing FIA returns to the right benchmark (not raw S&P 500 returns) produces an accurate picture
For pre-retirees and federal employees evaluating FIAs alongside TSP strategies, that analysis starts with a carrier-by-carrier comparison that includes renewal rate history alongside initial rates. Brokerage Consulting offers no-cost consultations — phone, virtual, or in-person — to walk through exactly this. To request one, visit bcfinserv.com/request-a-quote or call (888) 315-3608.
Frequently Asked Questions
What is the historical average return on a fixed indexed annuity?
Actual historical FIA returns varied significantly depending on the crediting method, cap rates in effect, and market conditions. Research on real contracts — not hypothetical models — showed annualized returns ranging from 3.89% to 9.19% across 5-year periods from 1997 to 2010.
What is the cap rate in an indexed annuity?
The cap rate is the maximum interest that can be credited in a given period, regardless of how much the index gains. Caps are set at contract issue and reset at each renewal period based on current interest rates and insurer discretion. Cap rates have risen in recent years alongside the higher interest rate environment following 2022.
How much does a fixed indexed annuity pay per month?
FIAs don't automatically pay monthly income; they accumulate value that can later be annuitized or accessed through an income rider. Monthly income depends on the accumulated contract value, the contract holder's age, and the payout option selected — all of which vary by product and carrier.
Do fixed indexed annuities lose money?
FIAs have a floor of 0% interest crediting in any down market year, so the account does not lose value due to index declines. However, annual fees (if applicable) and surrender charges during the surrender period can reduce effective value, so reviewing the full fee structure before purchasing is essential.
Are fixed indexed annuity returns guaranteed?
FIA returns are not guaranteed the way a fixed annuity's declared rate is. A minimum floor (typically 0%) is guaranteed, but actual credits depend on index performance and the carrier's renewal cap and participation rates. Both can change annually based on market conditions and insurer discretion.