
Introduction
A Fixed Indexed Annuity (FIA) illustration is typically the first document a prospective buyer sees — and misreading it can lead to poor product choices or badly misaligned return expectations.
Illustrations are required by state insurance regulators and designed to inform buyers — but they rely on assumptions like historical index returns and constant cap rates that rarely reflect what actually happens over a contract's lifetime. That gap between the document and reality is where most confusion starts.
LIMRA reported FIA sales hit $115 billion in 2024, up 20% year over year. More consumers than ever are reading these documents without fully understanding them.
This article explains what an FIA illustration actually shows, what it leaves out, and how to interpret one clearly — so the numbers on the page don't substitute for a realistic picture of what you might actually earn.
Key Takeaways
- An FIA illustration projects account growth, income values, and surrender charges — but it is not a guarantee of future performance.
- Illustrations show three historical scenarios: the most recent 10 years, best 10-year period, and worst 10-year period within the last 20 years.
- Cap rates, participation rates, and spreads are assumed constant in illustrations, though insurers typically reset them annually.
- Dividends from the underlying index are excluded from all credited interest calculations.
- An independent advisor who compares illustrations across carriers can help you catch unrealistic assumptions before you sign.
What Is a Fixed Indexed Annuity Illustration?
An FIA illustration is a standardized, insurer-generated document that projects how a contract may perform over time under defined assumptions. It covers both the accumulation phase (account value growth) and, where applicable, the income distribution phase.
Under NAIC Model Regulation #245 — the Annuity Disclosure Model Regulation — illustrations must include:
- Projected account values under multiple historical return scenarios
- Guaranteed death benefit and surrender values, clearly labeled as guaranteed
- Annual surrender charge schedules
- Penalty-free withdrawal amounts (typically 10% of account value per year)
- Income rider projections, if the contract includes one
- A narrative explanation of the crediting method, index used, caps, participation rates, and spreads
One important regulatory boundary: the SEC does not regulate FIAs. These are state-regulated insurance products, governed by state insurance commissioners and NAIC standards.
This distinguishes them from Registered Index-Linked Annuities (RILAs), which are securities subject to SEC and FINRA oversight and require a prospectus. FIA illustrations vary in format by insurer but must follow NAIC model guidelines where adopted by state law.
An illustration is not a prospectus, a performance guarantee, or a forward-looking projection. Every figure is built from historical data — which means how you interpret those numbers matters as much as the numbers themselves.
Key Components Found in an FIA Illustration
Crediting Method and Index
The illustration identifies which index the annuity tracks — most commonly the S&P 500, but sometimes Russell 2000, MSCI EAFE, or proprietary/exotic indexes — and the crediting method applied. Common methods include:
- Annual point-to-point — compares index value at the start and end of each contract year
- Monthly averaging — averages the index value across 12 monthly readings
- High water mark — credits based on the highest index point reached during the term
Proprietary or "exotic" indexes deserve extra scrutiny. Many are custom-built by investment banks and use backtested data engineered to look favorable. If the illustration involves an index you can't easily find quoted in financial news, ask the agent to explain the index construction and source data before signing anything.
Cap Rate, Participation Rate, and Spread
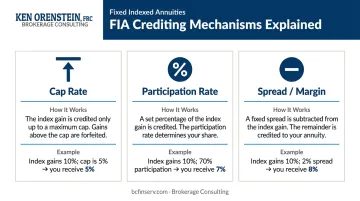
These three mechanisms determine how much of the index's gain actually gets credited to your account. Per the NAIC Buyer's Guide for Fixed Deferred Annuities:
| Mechanism | How It Works | Example |
|---|---|---|
| Cap Rate | Maximum interest the annuity can earn in a term | Index gains 10%; cap is 5% → you receive 5% |
| Participation Rate | Percentage of the index gain credited | Index gains 10%; 70% participation → you receive 7% |
| Spread/Margin | Fixed percentage subtracted from index gain before crediting | Index gains 10%; 2% spread → you receive 8% |
The Three Required Historical Scenarios
NAIC Model #245 Section 6F(9) mandates that every FIA illustration show exactly three scenarios:
- Most recent 10-year period — the last 10 calendar years of index performance
- Worst 10-year period — the continuous 10-year stretch in the last 20 years with the least index growth
- Best 10-year period — the continuous 10-year stretch in the last 20 years with the most index growth
All three are backward-looking replays, not forecasts. The regulation also requires a disclosure stating that the illustration assumes historical index performance repeats and that non-guaranteed elements remain unchanged — actual values may be higher or lower.
Surrender Charge Schedule and Income Rider Projections
The surrender charge table shows the penalty percentage if you withdraw funds before the contract term ends. These charges often start at 7–10% in year one and decline annually — and they directly affect the money you can actually access, not just projected values.
When an income rider is included (typically a Guaranteed Lifetime Withdrawal Benefit, or GLWB), the illustration shows projected annual income amounts. Those projections are built on a separate benefit base that grows at a stated roll-up rate — commonly 5–7% annually. The benefit base is not the same as the cash value available for withdrawal. Many buyers conflate the two, which leads to serious misunderstandings about liquidity.
The Limitations of FIA Illustrations You Need to Know
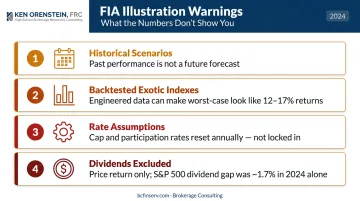
Historical Returns Don't Predict Future Performance
Morningstar's Spencer Look warned in August 2023 that FIA illustrations can be unreliable precisely because they replay historical scenarios rather than project future performance. When an illustration is generated at the tail end of a strong bull market, the "most recent 10-year" scenario can show unusually high credited returns that are unlikely to repeat.
The NAIC Life Insurance and Annuities Illustrations Working Group documented regulatory concern about this directly: regulators observed index annuity disclosures suggesting annual returns of 10%–25% for multiple years, raising questions about whether consumers were forming realistic expectations at the point of sale.
Backtested Exotic Indexes Can Inflate Every Scenario
Morningstar's analysis specifically flagged proprietary indexes that are custom-built and frequently backtested, meaning historical performance was engineered after the fact through data mining to identify strategies that looked favorable in hindsight. In one reviewed illustration, the low scenario showed an annualized return exceeding 12% and the high scenario approached 17% — both figures appearing under the "worst case" column.
NAIC Model #245 does require that if an index has not existed for at least 10 calendar years, its returns cannot be illustrated. But this rule doesn't prevent backtested performance from appearing in illustrations for newly created indexes with engineered historical data.
Cap and Participation Rates Are Assumed Constant — They Rarely Are
That backtesting problem is compounded by a second structural flaw: rate assumptions. Every projected account value in an illustration assumes today's cap rate, participation rate, or spread remains unchanged for the entire contract term. In practice, insurers reset these rates annually (or at each renewal period) based on prevailing interest rates and option costs.
If rates fall or option costs rise, renewal rates can land noticeably below what the illustration showed. Requesting an insurer's renewal rate history before purchasing is a critical step that illustrations don't prompt buyers to take.
Dividends Are Excluded
Investor.gov confirms that FIA interest credits are based on price return only, meaning dividends from the underlying index are not included in credited interest calculations. In 2024, the S&P 500 posted a price return of 23.31% but a total return of 25.02%, a gap of nearly 1.7 percentage points in a single year.
Over a multi-decade accumulation period, that dividend exclusion compounds into a substantial difference in actual wealth compared to direct index investing.
How to Read an FIA Illustration: A Practical Step-by-Step Approach
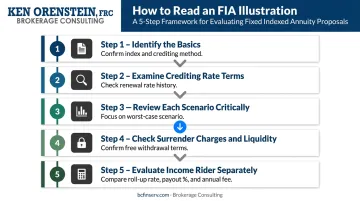
Step 1 — Identify the Basics
Before analyzing any numbers, locate:
- Product name and insurer
- Index being tracked
- Crediting method used
- Premium amount used in the illustration
Confirm the index is a standard, recognizable benchmark — not a custom index with limited real-world history or a name you've never encountered outside this document.
Step 2 — Examine the Crediting Rate Terms
Find the current cap, participation rate, or spread. Then ask:
- How long are these rates guaranteed?
- What is this insurer's renewal rate history?
- Is this an introductory "teaser" rate or a rate the carrier has maintained consistently?
A product with strong renewal rate consistency offers far more predictable real-world performance than one with an attractive first-year rate that drops sharply at renewal.
Step 3 — Review Each Scenario Critically
Don't take the most recent or best 10-year scenario at face value. Instead, focus primarily on the worst 10-year scenario — this gives you the realistic floor of likely outcomes under the contract structure.
If the illustration involves a proprietary index, ask whether the historical data is backtested. If the worst-case scenario shows unusually strong annualized returns, that's a red flag — the index data likely isn't grounded in real market history.
Step 4 — Check the Surrender Charge Period and Liquidity Terms
Once you understand what the scenarios project, the next practical question is how freely you can access those funds. Locate the surrender charge schedule and confirm the annual free withdrawal provision (typically 10% of account value per year, penalty-free).
For retirees who may need to access a larger portion of funds before the surrender period ends, the illustrated account value is not fully accessible money. Know exactly what it would cost to exit early.
Step 5 — Evaluate Income Rider Terms Separately
If an income rider is included, isolate these three figures:
- Roll-up rate on the benefit base (e.g., 6% annually during the deferral period)
- Payout percentage upon income activation (e.g., 5% of the benefit base at age 67)
- Annual rider fee (typically 1.0–1.5% of the benefit base)
Compare the illustrated income amounts to what alternatives — a bond ladder, an MYGA, or a SPIA — might provide for similar premium outlay. The rider fee reduces cash value growth; that cost must be weighed directly against the income guarantee it delivers.
How Brokerage Consulting Can Help You Navigate FIA Illustrations
FIA illustrations are produced by the insurer — and they're designed to present the product favorably. Without context to benchmark assumptions, compare renewal rate histories, or identify exotic index red flags, it's difficult for most buyers to read them objectively.
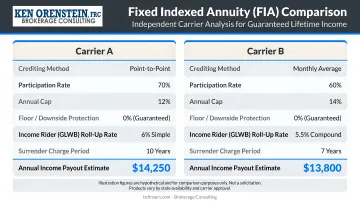
Ken Orenstein at Brokerage Consulting works as an independent advisor representing multiple top-rated insurance carriers. That independence matters: he can request illustrations from competing carriers, compare them side by side using the same premium amount and contract length, and flag unrealistic assumptions before a client commits. There's no incentive to favor one carrier's product over another's.
That independence also shapes how Ken works with clients: his approach is education-first. He covers the mechanics that drive illustrated numbers so clients understand what they're actually buying, not just what the projected columns show:
- Participation rates and cap structures
- Crediting methods and index selection
- Income rider roll-up rates and associated fees
This is especially valuable for federal employees navigating TSP distributions, FERS pension income, and supplemental retirement vehicles, where an FIA's role in the overall income plan needs to be clearly defined.
If you've been presented with an FIA illustration and want a no-pressure second opinion, or if you'd like to see competing illustrations compared side by side, contact Brokerage Consulting at (888) 315-3608 to schedule a no-cost consultation.
FIAs are not designed for short-term investments and may include caps, restrictions, fees, and surrender charges as described in the annuity contract. All guarantees are backed by the financial strength and claims-paying ability of the issuing carrier.
Frequently Asked Questions
What is an indexed annuity illustration?
An FIA illustration is a standardized document produced by the insurer that projects how the contract may perform under different historical return scenarios. It shows projected account growth, surrender charges, income values, and liquidity terms — but it is not a guarantee of future performance.
Are the returns shown in an FIA illustration guaranteed?
No. Illustrated returns are projections based on historical index performance, not guarantees. The only guaranteed elements in most FIAs are principal protection and, where applicable, a minimum interest floor. Actual credited interest depends on future index performance and renewal crediting rates.
What are the three scenarios in an FIA illustration?
NAIC regulations require three scenarios, all backward-looking replays of past index performance — not forward projections:
- Most recent 10-year index history
- Worst 10-year period from the last 20 years
- Best 10-year period from the last 20 years
Can cap and participation rates change after I buy an FIA?
Yes. Cap and participation rates are typically guaranteed only for the initial crediting period — often one year — then reset by the insurer at each renewal. Request the insurer's renewal rate history before purchasing; most buyers skip this step.
How do I compare FIA illustrations from different companies?
Use the same premium amount, crediting method, and index across illustrations where possible. Focus on the worst-case scenario rather than the highest illustrated number. Then compare rider fees, surrender charge periods, and renewal rate consistency across carriers.
What questions should I ask when reviewing an FIA illustration with an advisor?
Bring these questions to any FIA review:
- Is this a standard index or a backtested proprietary one?
- What is the insurer's renewal rate history?
- What are total fees, including rider charges?
- What is the surrender charge period and annual free withdrawal amount?
- How does the illustrated income compare to a SPIA or MYGA for my timeline?