
With more than 4.1 million Americans turning 65 every year through 2027, and EBRI's Retirement Security Projection Model finding roughly 40% of households at risk of running short, getting this calculation right matters more than ever.
This article covers what the formula is, what each variable does, how to calculate it with two worked examples, and the mistakes that send people to the wrong answer.
Key Takeaways
- A payout annuity starts with a lump sum and pays out equal, periodic withdrawals until the account reaches zero
- The formula is: P = d × [1 − (1 + r/n)^(−nt)] ÷ (r/n)
- Solve for P to find how much you need saved; solve for d to find how much you can withdraw
- Four variables drive every outcome: interest rate, time horizon, compounding frequency, and withdrawal amount
- The formula also helps evaluate annuity payout structures — fixed period, fixed amount, or lifetime income
What Is a Payout Annuity and How Does It Differ from a Savings Annuity
A payout annuity begins with a large lump sum and distributes it through equal, periodic withdrawals while the remaining balance continues to earn interest. At the end of the defined period, the account balance reaches exactly zero — that's the intended outcome, built into the math from the start.
This is the mirror image of a savings annuity (the accumulation phase), where many small deposits compound into a large sum. A payout annuity reverses that flow entirely. In retirement planning, these two phases typically follow each other: you accumulate for 30 years, then distribute for 20 or 25.
Two Core Assumptions in the Formula
The formula embeds two assumptions worth understanding upfront:
- Withdrawal frequency matches compounding frequency — monthly withdrawals assume monthly compounding (n = 12)
- The account depletes completely — the balance reaches zero at the end of period t
Two Common Real-World Applications
| Application | P represents | d represents |
|---|---|---|
| Retirement income drawdown | Starting nest egg | Monthly income |
| Mortgage / auto loan | Loan balance | Monthly payment |
The math is identical in both cases. OpenStax confirms that loan amortization uses the present value of an annuity formula — the same structure as retirement drawdown.
That shared structure also surfaces a terminology trap worth flagging: a payout rate (annual income ÷ premium) is a separate metric used to compare immediate annuity quotes. It is not the same as the interest rate variable in the payout annuity formula — a distinction that catches many annuity shoppers off guard.
The Payout Annuity Formula and Its Variables
The Two Formula Forms
Solving for starting balance (P):
P = d × [1 − (1 + r/n)^(−nt)] ÷ (r/n)
Solving for withdrawal amount (d):
d = P × (r/n) ÷ [1 − (1 + r/n)^(−nt)]
Both forms use identical inputs — you're just rearranging to isolate the unknown.
Variable Definitions
| Variable | Meaning | Common Values |
|---|---|---|
| P | Starting balance — what must be in the account on day one | Calculated or known |
| d | Regular withdrawal — the income received each period | Monthly, quarterly, or annual |
| r | Annual interest rate (as a decimal) — the rate the account earns | 0.05 for 5%, 0.07 for 7% |
| n | Compounding periods per year — must match withdrawal frequency | 12 (monthly), 4 (quarterly), 1 (annual) |
| t | Time in years — the account reaches zero at the end of this period | 20, 25, 30 years |
What the Negative Exponent Does
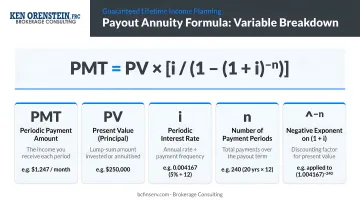
Of all five variables, −nt carries the most conceptual weight. It discounts a future stream of payments back to present value — quantifying how much principal is needed right now to fund all those future withdrawals. Without that negative exponent, you'd be calculating future value (savings accumulation), not present value (retirement drawdown). Flip that sign, and the formula shifts from projecting what your savings will grow to, to determining what lump sum you need today to sustain a chosen income for a set number of years.
How to Calculate a Payout Annuity: Step-by-Step with Examples
Solving for the Required Starting Balance (P)
Scenario: A retiree wants to withdraw $1,500 per month for 25 years from an account earning 6% annually, compounded monthly.
Identify the inputs:
- d = $1,500
- r = 0.06
- n = 12
- t = 25
Step-by-step calculation:
- Compute the periodic rate: r/n = 0.06 ÷ 12 = 0.005
- Compute total periods: −nt = −(12 × 25) = −300
- Evaluate the discount factor: (1.005)^(−300) = 0.2232
- Compute the numerator: 1 − 0.2232 = 0.7768
- Divide by the periodic rate: 0.7768 ÷ 0.005 = 155.507
- Multiply by d: $1,500 × 155.507 = $232,561
The retiree needs approximately $232,561 on day one of retirement.
Total withdrawals over 25 years = $1,500 × 12 × 25 = $450,000. Subtract the starting balance: $450,000 − $232,561 = $217,439 came from interest, not principal. Nearly half the total income came from compounding, not principal.
That dynamic — earning more from growth than you started with — is exactly what makes the second question worth asking: how large a withdrawal can a given balance actually support?
Solving for the Maximum Withdrawal Amount (d)
Scenario: A retiree has $400,000 saved, earning 7% annually compounded monthly, and wants withdrawals to last 20 years.
Identify the inputs:
- P = $400,000
- r = 0.07
- n = 12
- t = 20
Step-by-step calculation:
- Periodic rate: r/n = 0.07 ÷ 12 = 0.005833
- Total periods: nt = 12 × 20 = 240
- Discount factor: (1.005833)^(−240) = 0.2492
- Denominator: 1 − 0.2492 = 0.7508
- Apply the formula: d = $400,000 × 0.005833 ÷ 0.7508 = $3,101/month
Total withdrawals over 20 years: $744,240 — against a $400,000 starting balance, meaning roughly $344,240 comes from investment growth.
This same formula applies directly to loan amortization: replace P with a loan balance and d with the monthly payment, and the math is identical. The account, or loan, reaches zero when the final payment clears.
Key Factors That Affect Payout Annuity Outcomes
Interest Rate Sensitivity
The interest rate (r) is the single biggest variable in the formula. Small rate differences produce large shifts in required principal or supportable withdrawals.
For a $1,500/month withdrawal over 25 years, here's what the starting balance requirement looks like at different rates:
| Annual Rate | Required Starting Balance |
|---|---|
| 3% | $318,645 |
| 6% | $232,561 |
| 9% | $180,822 |
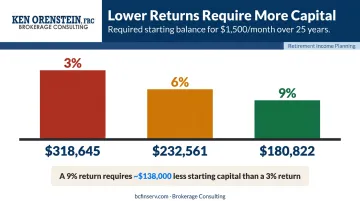
A 3-percentage-point rate difference translates to nearly $138,000 in required savings. This is why the rate assumption deserves careful scrutiny. Optimistic projections can make a retirement plan look funded when it isn't.
Time Horizon and Longevity Risk
A longer withdrawal period requires more starting principal — and the gap adds up faster than most people expect.
SSA actuarial data shows that a 65-year-old male can expect to live an additional 17.5 years; a 65-year-old female, an additional 20 years. Yet research from the Society of Actuaries found that 67% of retirees and 61% of pre-retirees underestimated average life expectancy — making too-short a time horizon one of the most common (and costly) planning errors.
For federal employees specifically, longevity planning is more nuanced because FERS or CSRS pension income, Social Security, and TSP distributions each have different duration characteristics. Ken Orenstein at Brokerage Consulting works with federal employees to model these layered income streams — pension, Social Security, and annuity-based guaranteed income — so that the payout annuity calculation reflects the actual income gap that needs to be filled, rather than total expenses.
Inflation: The Gap in the Standard Formula
The payout annuity formula calculates fixed dollar withdrawals each period — what planners call "nominal" payments. Inflation erodes their purchasing power over time. BLS data shows CPI-U rose 2.9% in 2024, and over a 20-year retirement, even moderate inflation compounds into a meaningful loss of real income.
Practical approaches to address this:
- Start with a larger principal balance that accounts for future purchasing power loss
- Use inflation-adjusted withdrawal products (COLA riders on SPIAs) that increase payments annually at a set rate (1%, 2%, 3%, or CPI-linked)
- Build in periodic portfolio reviews to adjust withdrawal amounts
Common Mistakes When Using the Payout Annuity Formula
Mismatching Compounding and Withdrawal Frequency
The formula assumes n and d operate on the same schedule. If you enter a monthly withdrawal amount but set n = 1 (annual compounding), the result will be wrong. Monthly withdrawals require monthly compounding (n = 12). When frequency and compounding differ, the periodic rate must first be converted to an equivalent payment-period rate before applying the formula.
Treating the Rate as Guaranteed
For fixed annuities with contractually locked rates, using that rate in the formula is appropriate — the contract locks it in. For investment accounts, the "rate" is an assumed average return, and actual returns vary year to year.
Plugging in an optimistic 8% assumption when realistic returns might average 5–6% over your retirement window can materially understate how much you need to save. Run the formula at multiple rate scenarios rather than committing to a single projection.
Confusing Payout and Savings Annuity Formulas
This is the most structurally damaging mistake. The two formulas look similar but serve opposite purposes:
| Formula Type | Exponent Direction | Purpose |
|---|---|---|
| Savings annuity (FV) | Positive (+nt) | Accumulation — deposits grow into a lump sum |
| Payout annuity (PV) | Negative (−nt) | Distribution — lump sum funds future withdrawals |
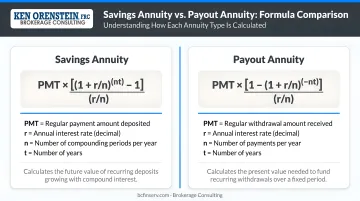
Using the future value formula for a drawdown scenario produces an answer that is far too large, suggesting you need far more saved than you actually do — or worse, far less, if the formula is reversed incorrectly.
Frequently Asked Questions
What is the payout annuity formula?
The formula is P = d × [1 − (1 + r/n)^(−nt)] ÷ (r/n), where P is the starting balance and d is the regular withdrawal. It calculates how much must be saved today to fund equal periodic withdrawals over a set timeframe, ending at zero.
What is an example of a payout annuity?
A retiree withdrawing $1,000 per month from a $139,581 account earning 6% annually, compounded monthly, for 20 years. The account pays out reliably each month and reaches exactly zero at the end of year 20.
How is a payout annuity different from a savings annuity?
A savings annuity accumulates wealth through regular deposits during the working years. A payout annuity distributes that wealth through regular withdrawals during retirement. In most retirement plans, these two phases follow each other in order.
Can the payout annuity formula be used to calculate mortgage payments?
Yes, the math is identical. A mortgage begins with a loan balance (P) and is reduced to zero through equal monthly payments (d), which is why loan amortization and retirement drawdown are mathematically the same problem.
What happens if I withdraw more than the formula allows?
The account depletes faster than planned and may reach zero before the intended end date. The formula ties your starting balance, interest rate, and withdrawal amount together — exceed the calculated withdrawal amount and the account's lifespan shortens accordingly.
How does inflation affect a payout annuity?
The standard formula assumes a fixed nominal withdrawal, so purchasing power shrinks as prices rise. Retirees can offset this by starting with a larger balance, choosing annuity products with COLA riders, or building in periodic withdrawal increases over time.